Risk reporting and risk control are the operational fix. Together, they create the visibility and the action required to reduce exposure before it becomes a claim, and reduce premiums before they compound another year.
This guide covers the definition of risk reporting, the five core control measures, what a strong risk report must include, how to build the process step by step, and best practices for organizations looking to tighten their risk programs — and lower their workers' compensation costs in the process.
Key Takeaways
- Risk reporting is the structured practice of documenting and communicating an organization's key risks, control status, and mitigation progress to decision-makers
- The five risk control measures — elimination, substitution, engineering controls, administrative controls, and PPE — form a hierarchy ranked from most to least effective
- A strong risk report includes an executive summary, risk register, KRIs, named ownership, and trend data
- Consistent risk reporting lowers workers' compensation costs by reducing claim frequency and demonstrating a proactive safety posture
What Is Risk Reporting and Why Does It Matter?
Risk reporting is the systematic process of identifying, assessing, documenting, and communicating organizational risks to the people who need to act on them — boards, senior leadership, compliance teams, and operations managers. The goal is informed decision-making before losses occur, not after.
OSHA's hazard identification framework draws from these same sources: injury and illness records, workers' compensation data, near-miss reports, incident investigations, and control status information. Together, they give decision-makers a complete picture of where exposures actually live.
Beyond Compliance
Effective risk reporting does more than satisfy a regulatory checkbox. It:
- Supports proactive loss prevention by surfacing hazards before they produce claims
- Prioritizes resource allocation by ranking risks against each other
- Creates a defensible audit trail that demonstrates good-faith safety management
- Feeds the EMR calculation with better data — which directly affects what you pay at renewal
The cost stakes are significant. The average workers' compensation claim costs $47,316 for accident years 2022–2023, with falls averaging $54,499 and motor vehicle crashes averaging $91,433. A single uncontrolled exposure producing two lost-time claims per year adds nearly $100,000 to an organization's loss run — and three years of that history compounds into every renewal premium.
Understanding those numbers makes the reporting-versus-control distinction worth spelling out clearly.
Reporting vs. Control: A Critical Distinction
These two functions are often conflated, but they do different jobs.
Risk reporting creates visibility: what risks exist, how severe they are, and whether mitigation is working. Risk control refers to the specific measures deployed to reduce or eliminate those risks. Neither works without the other. Reporting without control leaves you with a documented record of things getting worse. Control without reporting means taking action you can't measure, defend, or credit at renewal.
The 5 Core Risk Control Measures Every Business Should Know
The Hierarchy of Controls is the internationally recognized framework for managing workplace risk. NIOSH ranks the five control tiers from most to least effective, and the guiding principle is clear: address risk at the highest possible tier before relying on lower-order measures.
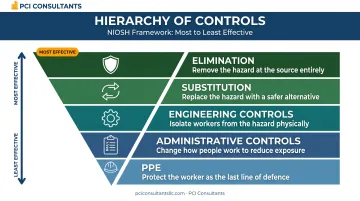
Elimination
Elimination is the most effective control because it physically removes the hazard entirely — discontinuing a dangerous task, retiring defective equipment, restructuring a process so the exposure no longer exists. It's the only control that guarantees the risk is gone, which is why it should always be evaluated first, even when it seems impractical.
Substitution
When elimination isn't feasible, substitution replaces a hazardous process, material, or activity with a safer alternative — switching to a less toxic chemical, using mechanical lifting instead of manual labor, swapping a high-risk tool for a lower-risk equivalent. Substitution reduces the severity of potential exposure rather than eliminating it outright.
Engineering Controls
Engineering controls are physical or design changes that isolate workers from the hazard: machine guards, ventilation systems, ergonomic workstation redesign, automated material handling. Their key advantage is that they don't depend on employee behavior to work. A guard is either in place or it isn't.
NIOSH data from Ohio's Safety Intervention Grant program found that engineering controls were associated with $4–$7 million in avoided workers' compensation costs per year between 2013 and 2017 — a direct measure of what moving up the hierarchy actually delivers.
Administrative Controls
Administrative controls change how work is performed through policy and procedure: job rotation to limit exposure duration, mandatory rest breaks, standard operating procedures, pre-shift safety briefings. These are meaningful controls, but they require ongoing enforcement and human compliance to remain effective — which makes them less reliable than engineering controls over time.
Personal Protective Equipment (PPE)
PPE is the last line of defense, not the first. It protects the worker only when the hazard cannot be eliminated, substituted, or engineered away. Relying primarily on PPE — handing out safety glasses and calling it loss control — is a costly mistake in high-claim industries. OSHA places it last for a reason: it requires constant effort, proper use, and training to remain effective, with no backup when it fails.
Common PPE-first pitfalls include:
- Treating PPE as a substitute for engineering or design fixes
- Skipping fit testing and retraining after incidents
- Providing equipment without enforcing consistent use
PCI Consultants' in-house risk and claims managers work directly with clients to assess which control tier is actually being applied across their operations — and to help businesses move from PPE reliance toward more structural controls, which is a key driver of reduced workers' compensation losses.
What Should a Risk Report Include?
A risk report is only as useful as its structure. Too vague and leadership can't act. Too dense and no one reads it. The following elements are non-negotiable.
Executive Summary
The executive summary should give a senior leader the full risk picture in under two minutes. At minimum, it must cover:
- Current high-priority risks and their status
- Changes since the last reporting period
- Open or overdue corrective actions
- Any immediate red flags requiring a decision
If it requires explanation to be understood, it needs to be rewritten.
Risk Register
The risk register is the backbone of the report: a structured list of all identified risks, each tagged with:
- A unique ID and category (operational, financial, compliance, safety)
- A likelihood score and severity score
- Current status and assigned owner
A consistent scoring method — such as a likelihood-by-severity matrix — keeps the register comparable across time periods and departments. An entry that scores "high" in one division should mean the same as "high" in another.
Key Risk Indicators (KRIs)
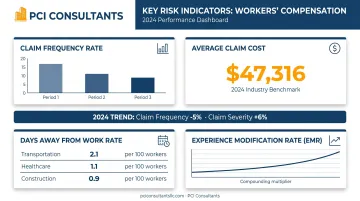
KRIs are measurable metrics that signal when a risk is growing or approaching an action threshold. In a workers' compensation context, the relevant KRIs include:
- Claim frequency rate — how often claims occur relative to hours worked or headcount
- Average claim cost — tracking against industry benchmarks (e.g., $47,316 all-claims average from NCCI/NSC data)
- Days away from work (DAFW) rate — BLS 2024 benchmarks show transportation and warehousing at 2.1 DAFW per 100 workers, healthcare at 1.1, construction at 0.9
- Experience modification rate (EMR) — the compounding multiplier that ties everything to premium
One critical nuance: NCCI's 2025 State of the Line shows that 2024 lost-time claim frequency declined 5% while medical and indemnity severity each rose 6%. A frequency-only dashboard can miss a severity-driven cost increase. Track both.
Tracking KRIs is how programs move from cost-response to cost-prevention. PCI Consultants monitors injury frequency, injury severity, claim duration, return-to-work velocity, litigation rate, and fraud incidence as the core leading indicators of workers' compensation loss ratio.
Mitigation Plans and Ownership
Every risk in the register must be tied to a specific mitigation strategy with a named owner, an implementation timeline, and a current status. Vague responsibility — "the safety team will handle it" — is how corrective actions stall indefinitely.
The report should clearly distinguish between risks with active controls in place and those still awaiting action. Uncontrolled risks sitting in that gap are where the most preventable losses occur.
Trend Data and Progress Tracking
Trend data turns a risk report from a snapshot into a management tool. Include a section that tracks whether high-severity risks are increasing, decreasing, or stable over rolling periods. Trend data is what allows organizations to prove their risk programs are working — and to justify continued investment in loss control at renewal.
How to Build an Effective Risk Reporting Process
A risk report is only as good as the process behind it. Without a repeatable workflow, reporting becomes inconsistent, gaps emerge, and the data loses credibility with the people making decisions.
Step 1 – Identify and Categorize Risks
Risk identification should pull from multiple sources simultaneously:
- Incident logs and near-miss reports
- Workers' compensation loss runs and open claims data
- Field observations and supervisory reports
- Regulatory audits and prior inspection findings
- Historical loss runs by cause, nature of injury, and department
Organize risks into categories — safety/operational, financial, compliance, reputational — so patterns surface faster and ownership is immediately clearer.
Step 2 – Assess Likelihood and Impact
OSHA's hazard identification guidance instructs employers to determine the severity and likelihood of each identified hazard, then use that information to prioritize corrective action. A 5×5 likelihood-by-impact matrix gives organizations a consistent scoring standard across departments.
The scoring must be standardized — a "high" risk in operations should carry the same weight as "high" in logistics, or the register becomes meaningless.
Step 3 – Assign Ownership and Develop Mitigation Plans
Each identified risk needs a named owner. A usable mitigation plan includes:
- The chosen control measure — and where it sits in the hierarchy
- Implementation timeline — with a realistic completion date
- Resource requirements — budget, personnel, equipment
- Defined success criteria — what "done" actually looks like
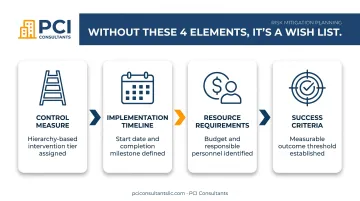
Without these four elements, a mitigation plan is a wish list.
Step 4 – Monitor, Report, and Refine
Risks should be reviewed on a scheduled cadence:
- Monthly: operational and safety risks
- Quarterly: strategic and compliance-level risks
KRIs should be tracked between formal reporting periods to catch emerging issues before they escalate.
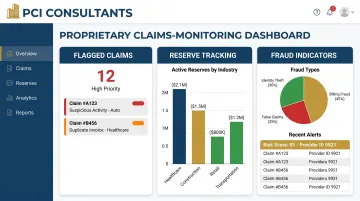
For most employers, this is also where internal monitoring hits its limits. PCI Consultants' proprietary claims-monitoring software, calibrated against 80+ active programs across healthcare, construction, trucking, and manufacturing, surfaces flagged claims early, tracks reserve adequacy, and identifies fraud-indicator patterns that no single employer could detect at their own claim volume.
Most organizations with 100–500 employees don't generate enough claims data to build reliable fraud-indicator thresholds or forward-model EMR compounding across multiple state rating bureaus. PCI's 30+ years of model development, backed by a live dataset spanning over 80 active programs, provides monitoring infrastructure that makes Step 4 a genuine early-warning function rather than a quarterly checkbox.
Best Practices for Stronger Risk Reporting and Control
Tailor Reports to the Audience
A board-level risk summary should look nothing like an operations-level risk register. Leadership needs top-line exposure and trend direction. Operations needs specific hazards, control status, and corrective action owners. One-size-fits-all documents get skimmed by everyone and used by no one.
Use Visuals to Surface What Raw Data Buries
Heat maps, trend lines, and status dashboards let stakeholders immediately see whether risk exposure is improving or worsening. The Campbell Institute's visual literacy research confirmed that trained workers identified hazards that would otherwise have gone unnoticed — the same principle applies to how leadership interprets risk data.
Build a Culture Where Risk Data Flows Upward Freely
Frontline workers and supervisors are often the first to see emerging hazards. Reporting systems that are burdensome, punitive, or consistently ignored at the management level will suppress exactly the information organizations need most.
Campbell Institute research confirms that incident and near-miss reporting drops sharply when employees don't believe management will act on what they submit. The real fix is demonstrating, consistently, that reported risk data leads to visible corrective action.
Frequently Asked Questions
What are the 5 risk control measures?
The five risk control measures are elimination, substitution, engineering controls, administrative controls, and personal protective equipment (PPE), ranked from most to least effective. NIOSH's Hierarchy of Controls establishes this ranking, with elimination being the only measure that guarantees the hazard no longer exists.
What should a risk report include?
A complete risk report covers five core elements:
- Executive summary for leadership decision-making
- Risk register with scored and categorized risks
- Key risk indicators (KRIs) such as claim frequency and EMR
- Mitigation plans with named owners and deadlines
- Trend data showing whether exposure is improving or worsening
How often should a risk report be updated?
Operational and safety risks should typically be reviewed monthly, while strategic and compliance-level risks are commonly reported quarterly. High-priority or rapidly changing risks — such as an open litigation cluster or a sudden spike in a specific injury type — may require more frequent ad hoc reporting.
Who is responsible for risk reporting in an organization?
Responsibility sits with the risk management or ERM function, with individual risk owners contributing updates on their areas. Senior leadership and audit committees review reports for oversight. External partners like PCI Consultants provide the monitoring tools and claims oversight that most internal teams lack.
What is the difference between risk reporting and risk control?
Risk reporting creates visibility — documenting what risks exist, how severe they are, and whether mitigation is working. Risk control refers to the active measures deployed to reduce or eliminate risks, such as engineering changes, administrative policies, and PPE. Both are essential: without control measures in place, reporting only confirms that conditions are getting worse.
How does effective risk reporting help reduce workers' compensation costs?
Structured risk reporting identifies hazards before they produce claims and supports early intervention through corrective action tracking. This directly reduces claim frequency, improves your EMR, and lowers workers' compensation premiums at renewal — all of which carriers reward.